Heatmaps

Heatmaps that show how users really behave

Stop guessing why pages don’t convert. Optibase heatmaps show where users click, scroll, and move, so you can see what gets attention, what gets ignored, and what to test next.
Click behavior: See where users actually click.
Scroll depth: Know how far visitors scroll.
Test-ready insights: Turn insights into better tests.
Header image
Join 1800+ companies already testing with Optibase
Visual behavior insights

See how users actually interact

Numbers tell you what happened. Heatmaps show you how it happened. Optibase turns user behavior into clear visuals, so you can see what gets attention, what gets ignored, and where users struggle on your pages.

Click behavior at a glance

See where users click, tap, and interact on your pages. Spot missed clicks, distractions, and elements that draw real attention.

Scroll depth insights

Understand how far visitors scroll and which sections get seen or skipped. Learn where interest drops off and content loses impact.

Instant visual clarity

Heatmaps make behavior easy to understand without digging through reports. Patterns and issues stand out right away.
Performance safe

Heatmaps without performance risk

Heatmaps are only useful if they don’t hurt your site. Optibase runs heatmaps with a lightweight script that does not cause flicker, slow pages, or affect SEO, so you can collect insights safely on live traffic.

Lightweight tracking

Heatmaps run using a small script that loads fast and stays out of the critical path.

No flicker or layout shifts

Visitors see the page normally. Heatmaps never flash or change content during load.

SEO-safe by design

Heatmaps do not interfere with crawling, indexing, or page structure.
Built for optimization

Turn insights into better tests

Heatmaps are most powerful when they guide action. Optibase heatmaps help you spot friction, confusion, and missed opportunities, so you know exactly what to test and why certain variants win or lose.

Find ideas worth testing

Use heatmaps to spot weak sections, ignored CTAs, or confusing layouts before guessing what to change.

Explain test results

See how user behavior changes between variants. Understand why a test wins or loses, not just the final number.

One optimization workflow

Heatmaps work alongside A/B testing, personalization, and analytics, keeping insights and actions in one place.
How it works

Set up heatmaps in minutes

Optibase makes heatmaps easy to use. Install once, add a page URL, and start collecting real user behavior. No complex setup or configuration required.

Install Optibase

Install Optibase using the Webflow App or by adding one lightweight script to your site. This enables heatmaps across your pages without extra setup. You only need to install it once, and it runs safely in the background without slowing down your site or affecting SEO.

Add a page URL

Enter the URL of the page you want to analyze. This tells Optibase where to start collecting heatmap data. You can add any live page on your site, such as a landing page or key flow. Once the URL is added, heatmaps begin tracking automatically without extra configuration.

Collect live behavior data

Once the page is active, Optibase starts collecting heatmap data from real visitors. It tracks clicks, scroll depth, and cursor movement as users interact with the page. Data is gathered on live traffic, so insights reflect real behavior, not test sessions or simulations.

View heatmaps

Open the heatmap for your page to see user behavior overlaid directly on the design. Clicks, scroll depth, and movement are shown as clear visual patterns. This makes it easy to spot areas that get attention, sections users ignore, and potential friction without digging through reports.

Turn insights into actions

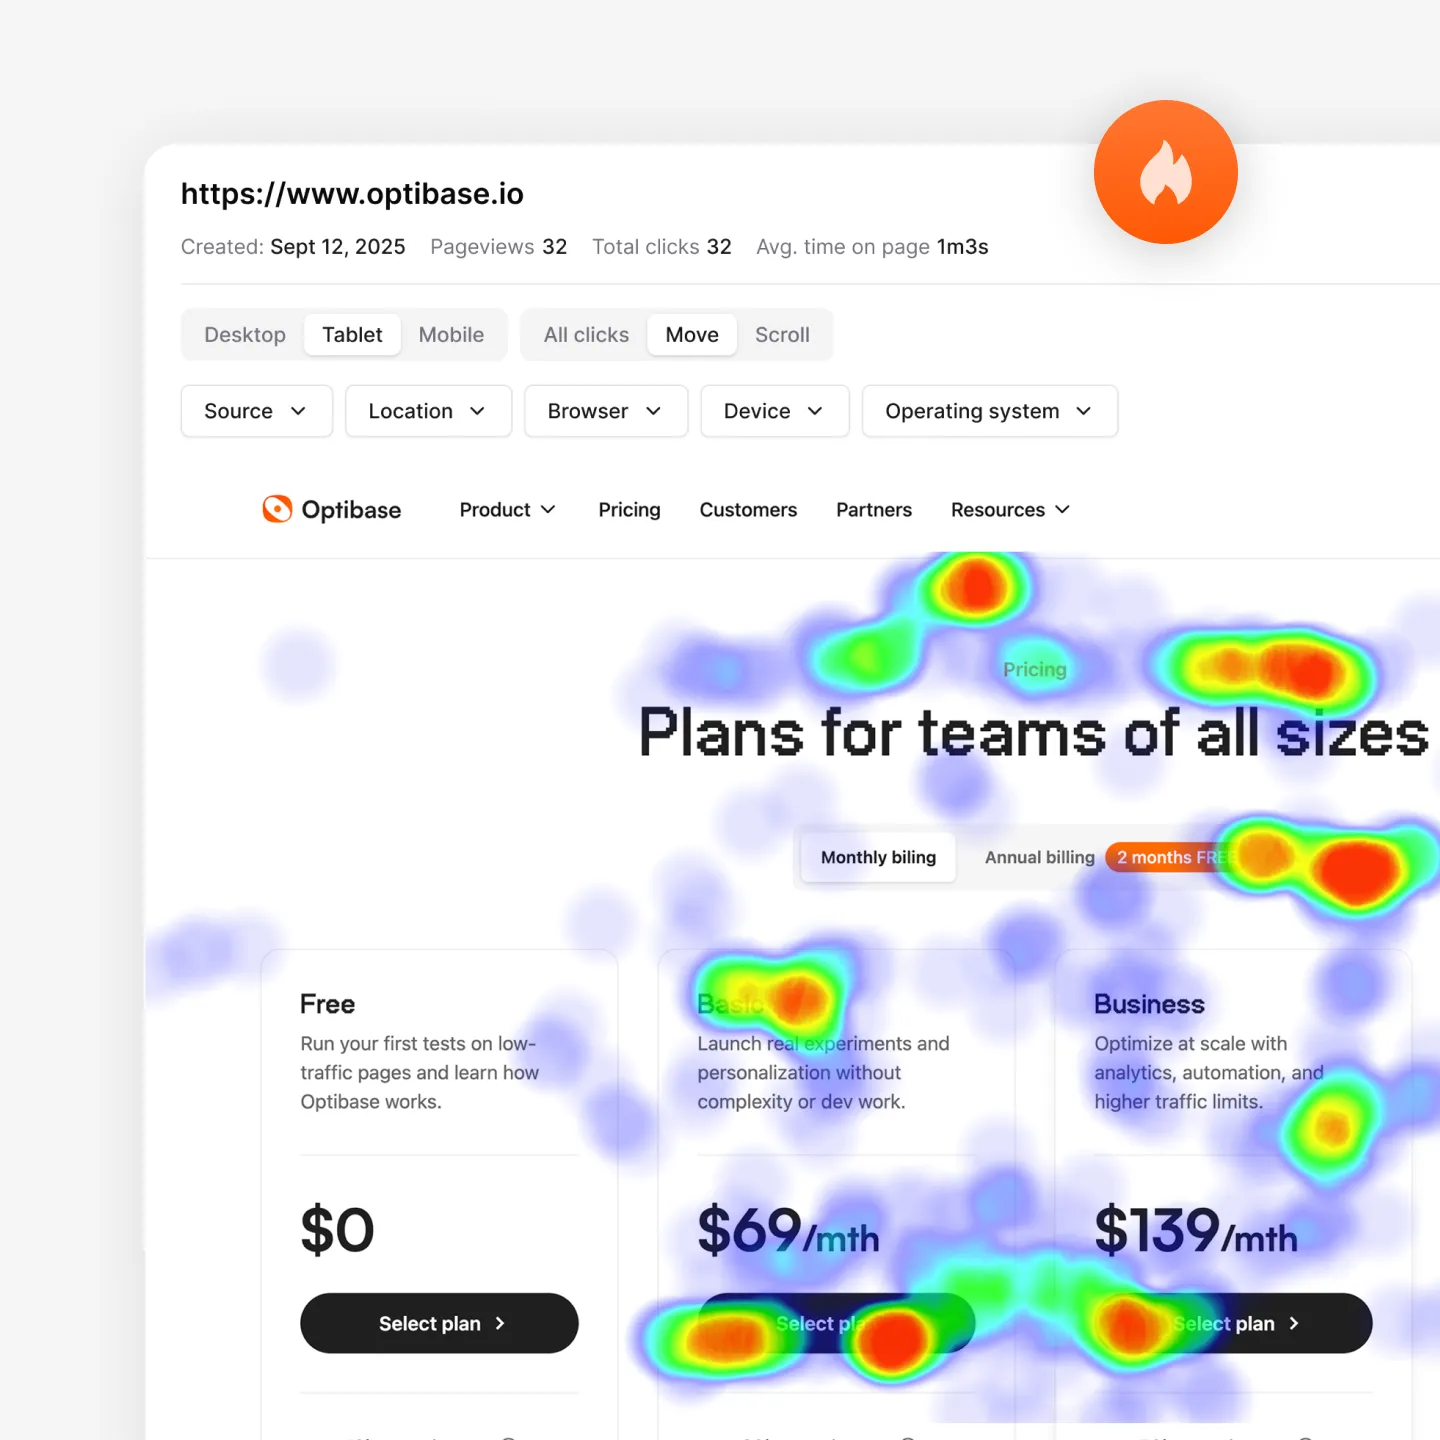
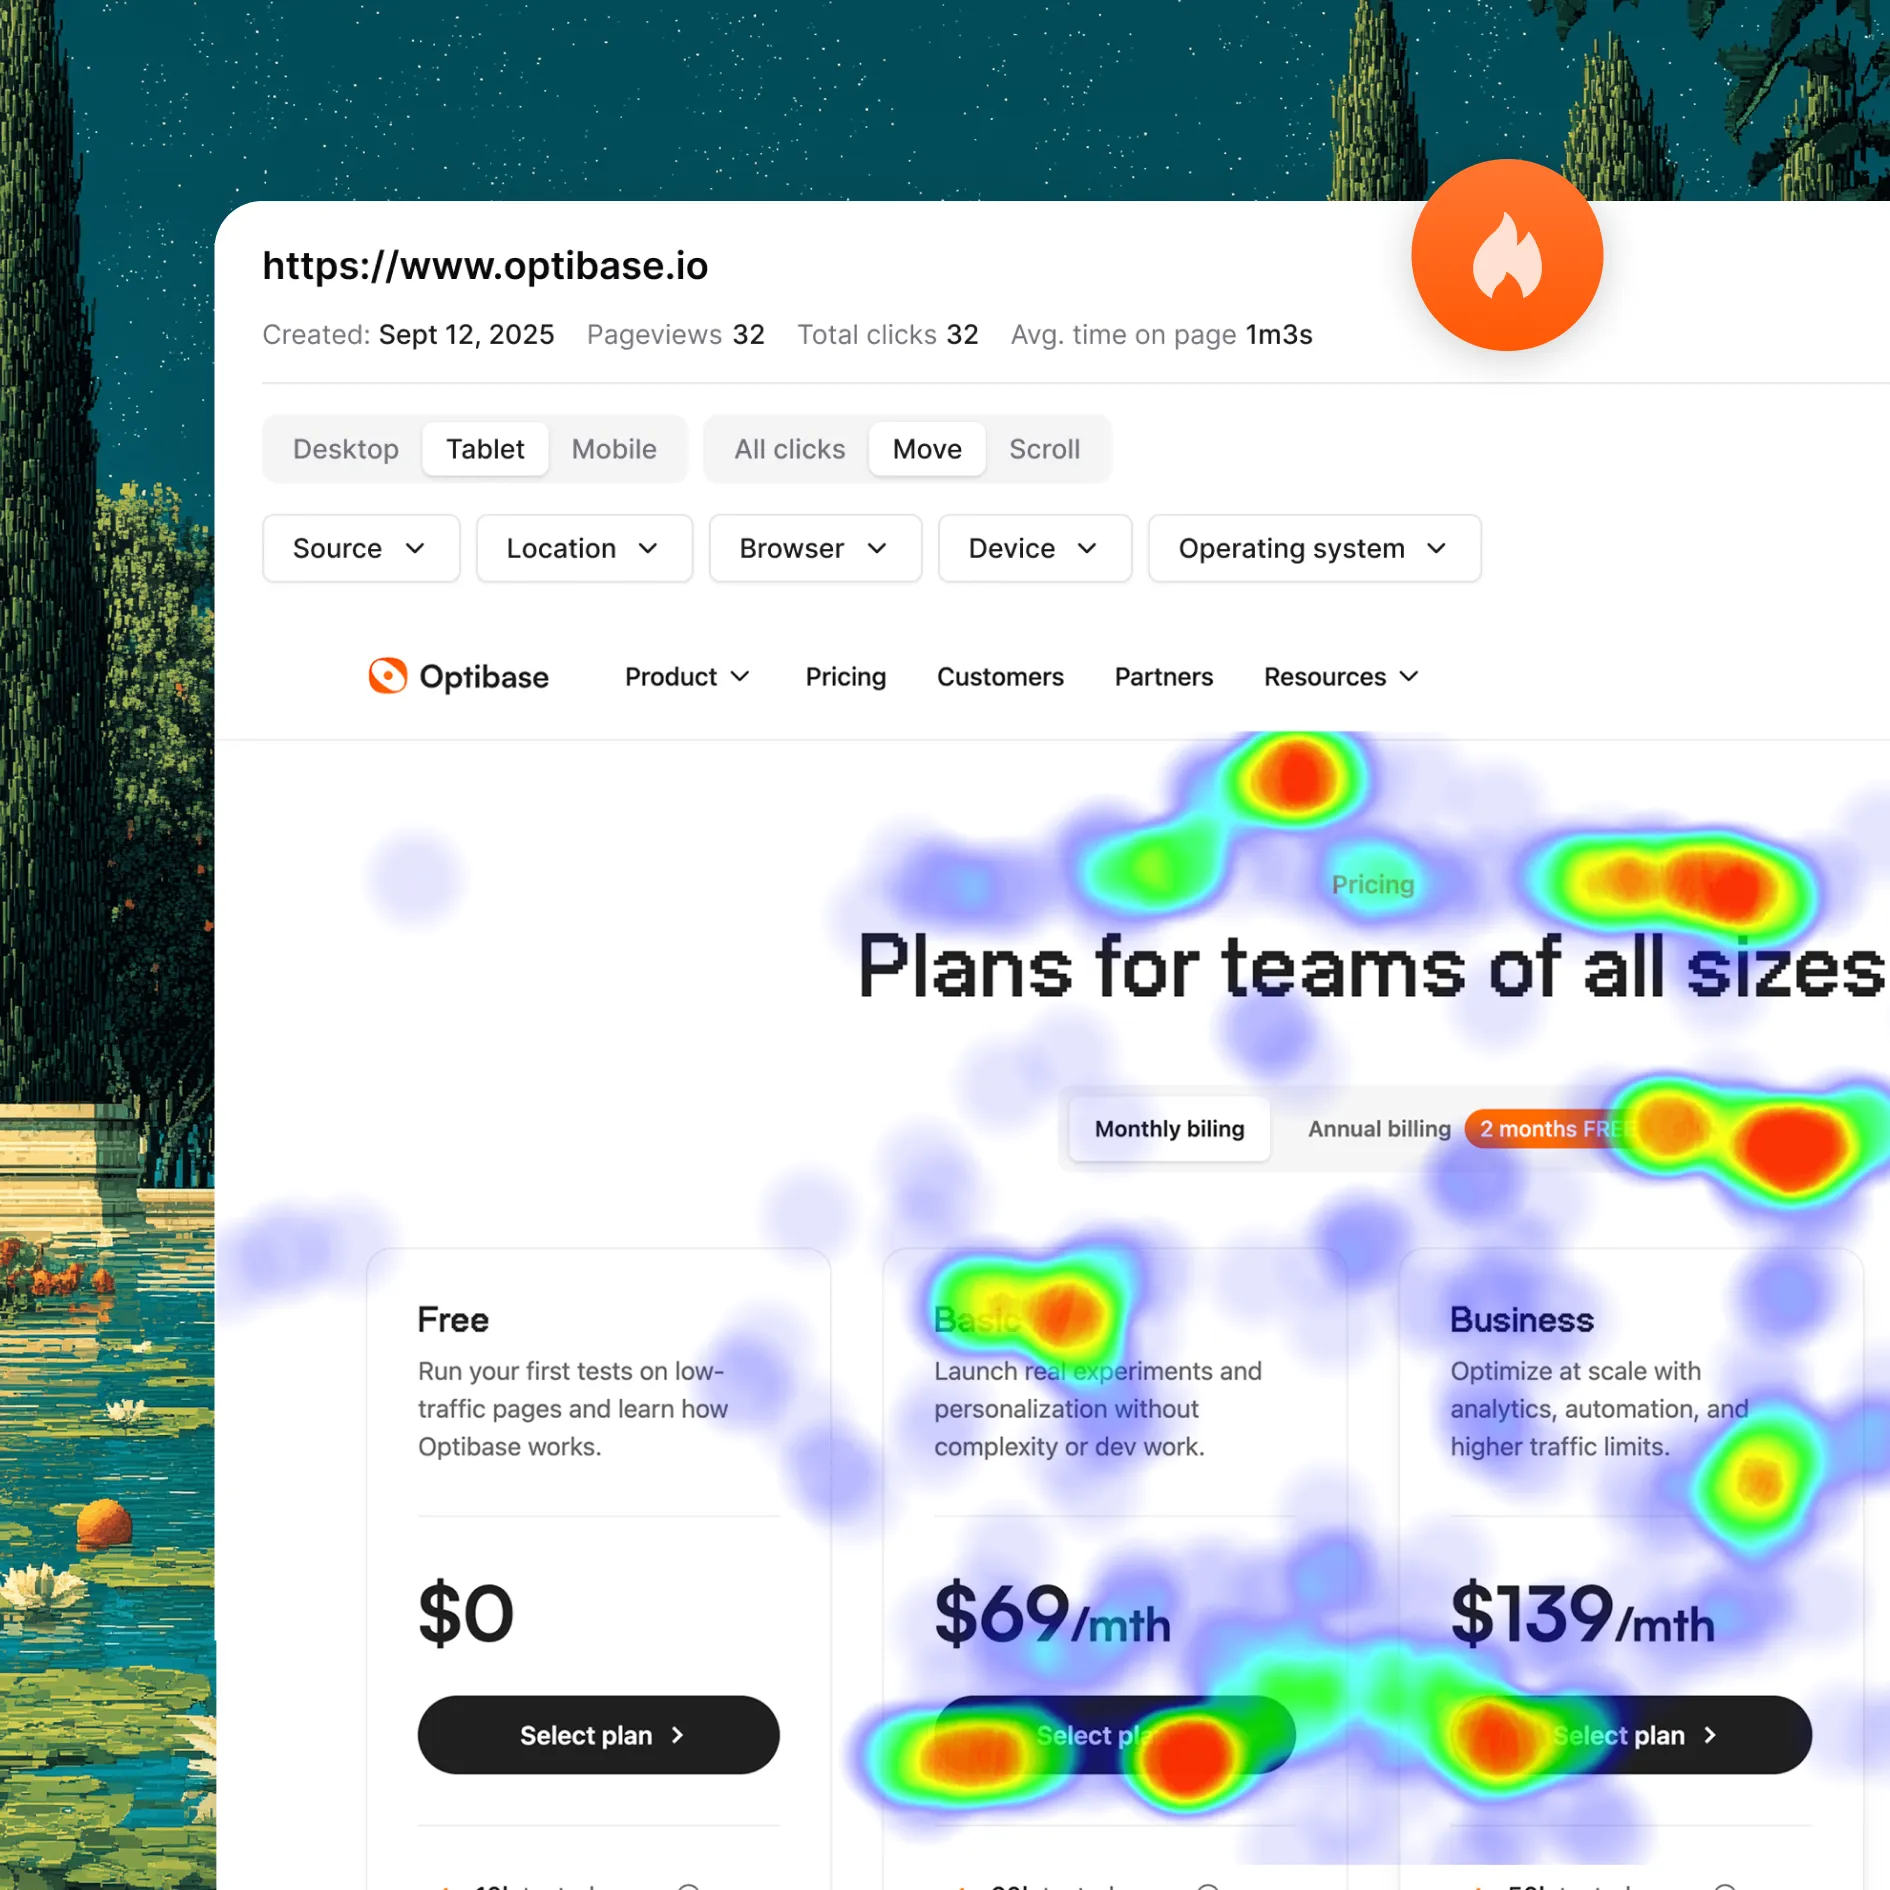
Use heatmap insights to improve your pages with confidence. Identify confusing sections, ignored elements, or missed clicks, then adjust layouts, copy, or CTAs. Heatmaps also help you decide what to test next using A/B testing or personalization, turning visual insights into measurable improvements.
Built for growth

More than just testing

AI traffic split

AI helps send more visitors to the version that works better, so your test reaches a clear winner faster without extra work.

Auto-stop tests

Set rules and let Optibase stop the test for you. When a version wins or a goal is reached, the test ends and you get clear results.

Audience segmentation

By segmenting your audience based on their geolocation, browser, OS and screen size, you can limit who is exposed to your tests.

Personalization

Show different content based on who visits your site. Tailor pages by audience, behavior, or context to improve relevance and conversions.

Heatmaps

See where users click, scroll, and focus. Heatmaps help you understand behavior so you know what to test and what to improve next.

User recordings

Watch real sessions to see how people use your site. Spot friction, confusion, and missed clicks that numbers alone can’t show.
FAQ

Frequently asked questions

What are heatmaps and how do they work?
Heatmaps are visual tools that show how people interact with a page. They highlight where users click, how far they scroll, and which areas get the most attention. Optibase heatmaps collect this data from real visitors and display it as simple visuals, making user behavior easy to understand at a glance.
What can I learn from heatmaps?
Heatmaps help you see how users actually use your pages. You can learn which elements get attention, which sections are ignored, and where users stop scrolling. This makes it easier to spot friction, improve layouts, and decide what changes are worth testing next.
Are heatmaps safe for SEO?
Yes. Optibase heatmaps are safe for SEO. They do not change your page content, structure, or URLs. Search engines see the same page as users, so crawling, indexing, and rankings are not affected while heatmaps run.
Can I use heatmaps with A/B testing?
Yes. You can use heatmaps alongside A/B testing in Optibase. Heatmaps help you understand how users behave on each variant, showing why one version performs better than another. This gives you deeper insight than conversion numbers alone.
What types of heatmaps does Optibase offer?
Optibase offers click, scroll, and movement heatmaps. Click heatmaps show where users click or tap. Scroll heatmaps show how far visitors scroll on a page. Movement heatmaps show how users move their cursor, helping you understand attention and intent across your pages.
Do heatmaps slow down my website?
No. Optibase heatmaps do not slow down your website. They run using a lightweight script that loads quickly and works in the background. There is no flicker or delay for visitors, so your page speed and user experience stay the same while heatmaps collect data.
How do heatmaps help with conversion optimization?
Heatmaps show where users click, scroll, and hesitate, helping you spot friction and missed opportunities. You can see which elements attract attention and which are ignored. This makes it easier to decide what to change, what to remove, and what to test to improve conversions.
Do heatmaps work on live traffic?
Yes. Optibase heatmaps work on live traffic from real visitors. They collect data as users interact with your site, so insights reflect real behavior, not simulations or test sessions. This helps you make decisions based on how your site is actually used.