Every team running A/B tests eventually learns the same lesson the hard way: the metric you pick determines what counts as a win.
A button color "wins" on click-through but tanks revenue. A new pricing page lifts trial signups but kills paid conversions a month later. A checkout redesign improves the primary funnel but quietly breaks the mobile experience nobody bothered to track.
The good news: picking the right metric is a learnable skill, not a judgment call. There's a small set of metrics worth tracking, a clear way to choose between them based on what you're testing, and a short list of statistical concepts that protect you from fooling yourself.
The bad news: most teams skip this part. They pick a metric because it's the one their analytics tool already shows, run the test, watch the number move, and ship the winner. Then they wonder why their A/B testing program "doesn't move the business."
This guide covers everything you need to know about A/B testing metrics — written for marketers, founders, and CRO leads who want to run rigorous experiments without overcomplicating it.
What you'll walk away with:
Most A/B tests don't fail because the experiment was run badly. They fail because the wrong metric was measured.
A button color "wins" on click-through but tanks revenue. A new pricing page lifts trial signups but kills paid conversions a month later. A checkout redesign improves the primary funnel but quietly breaks the mobile experience nobody bothered to track.
The metric you pick determines what counts as a win. Pick the wrong one and you'll ship changes that look like progress and feel like decline. The next sections give you a framework for not doing that.
.png)
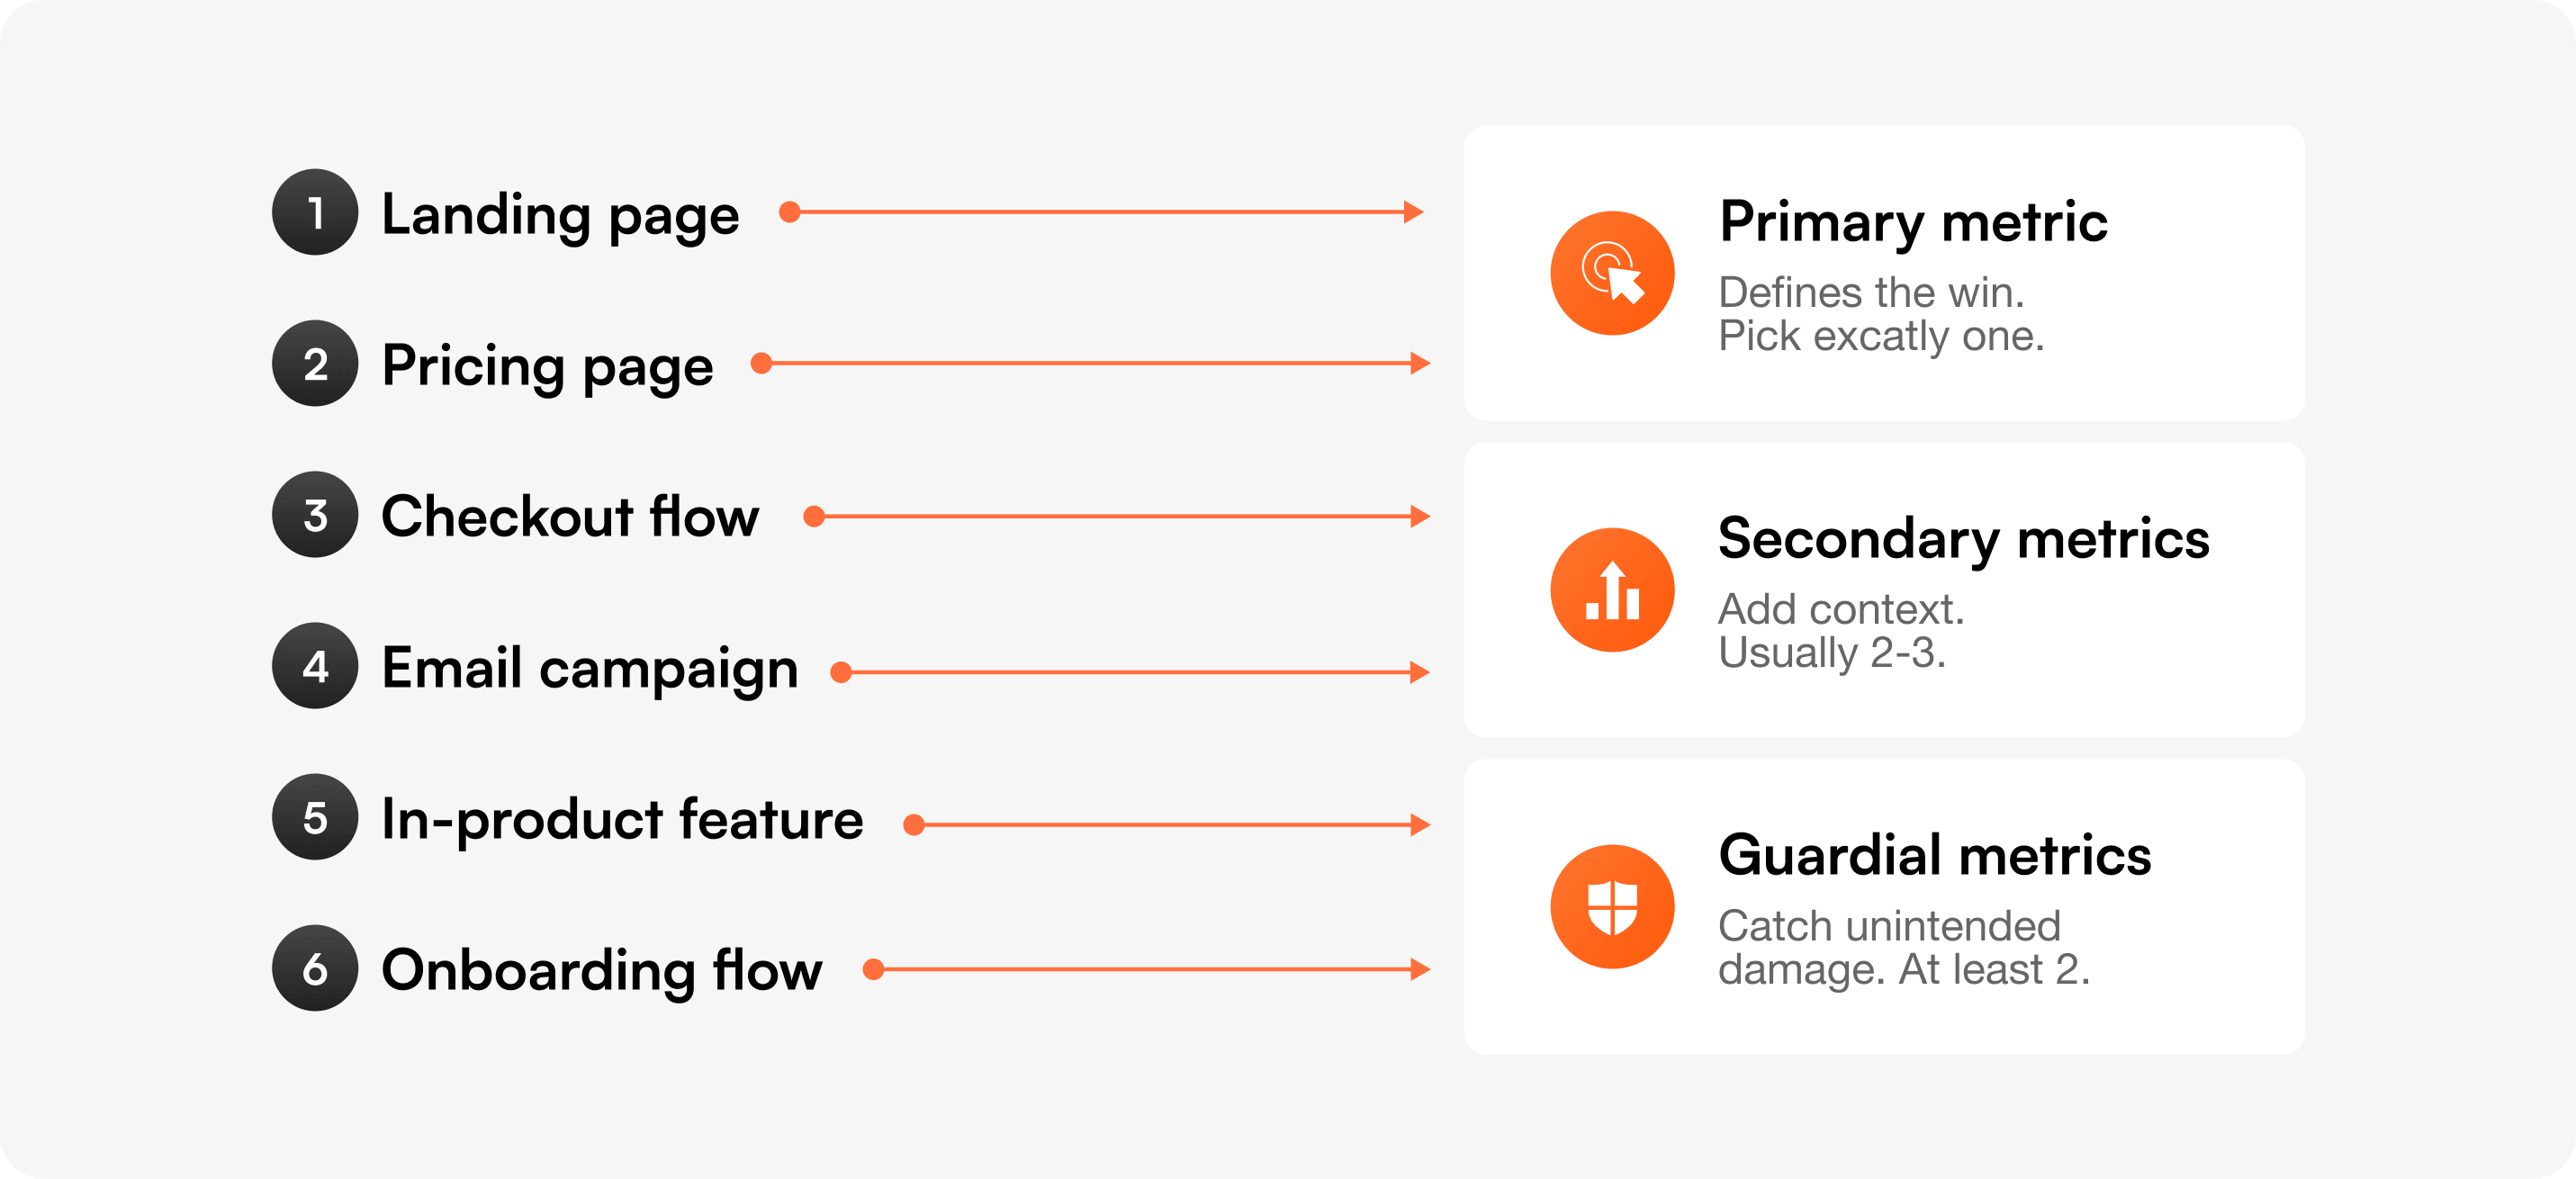
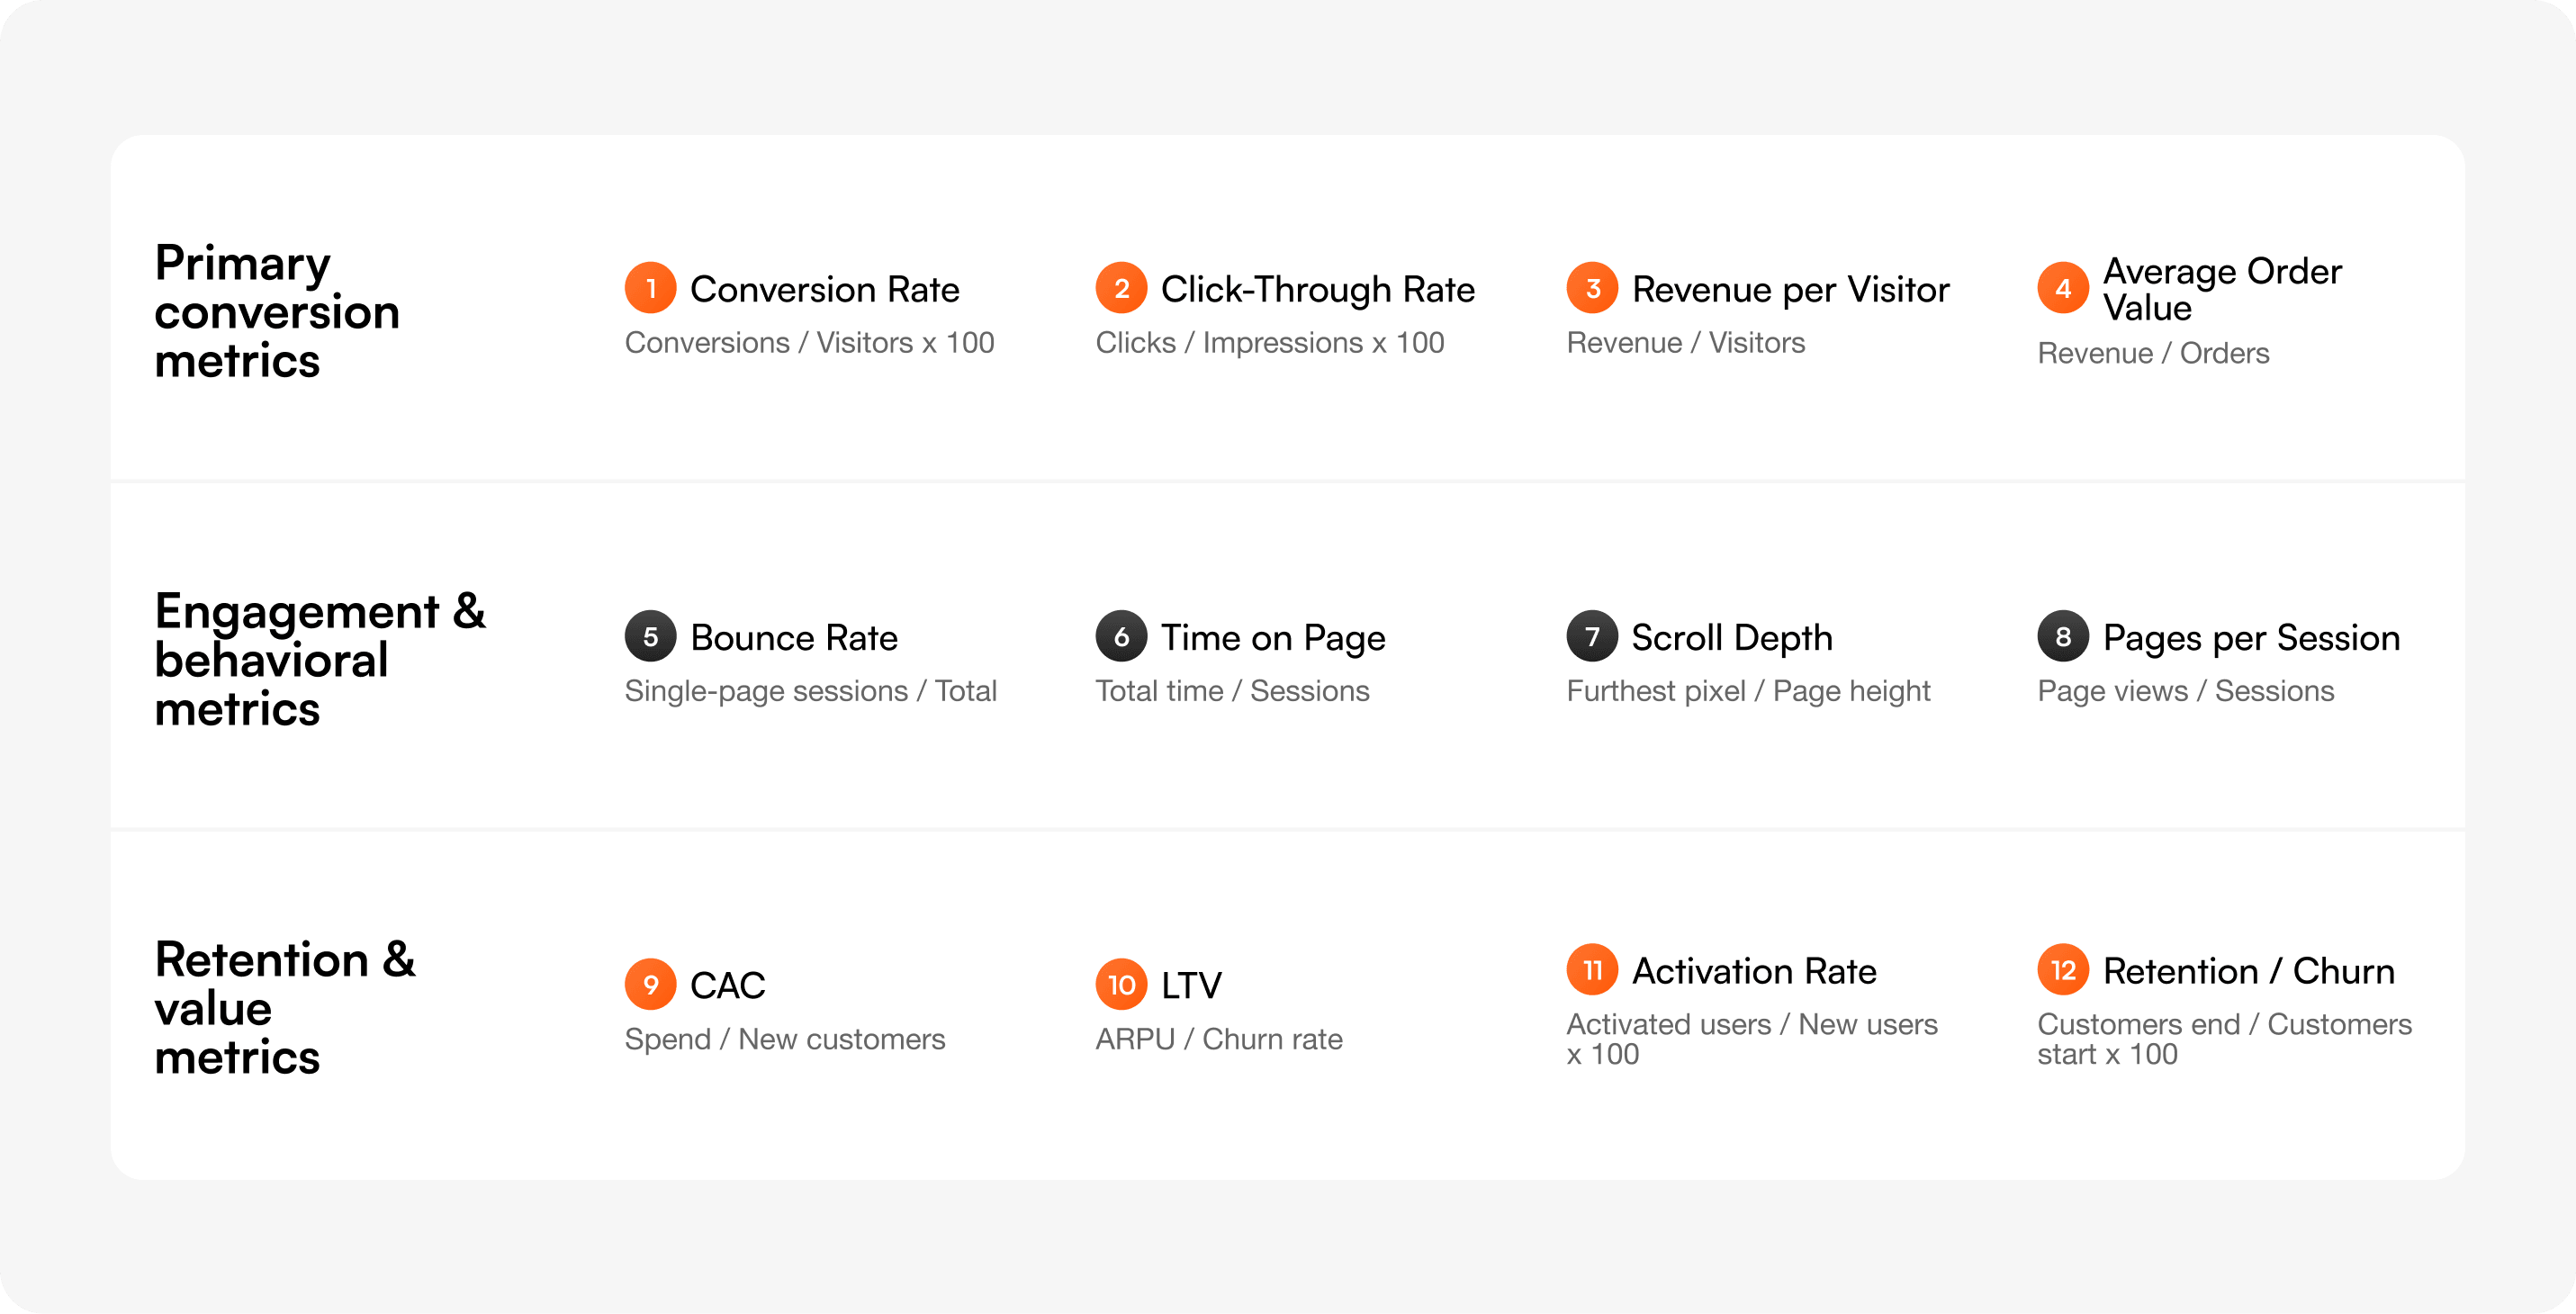
Every A/B test should have one primary metric that defines the win, two or three secondary metrics that add context, and at least two guardrail metrics that catch unintended damage.
The primary metric is non-negotiable. If you're "testing for both conversion and engagement," you're really testing for nothing — because you'll cherry-pick whichever moves first. Pre-register the primary before the test starts. Write it down. Lock it in.
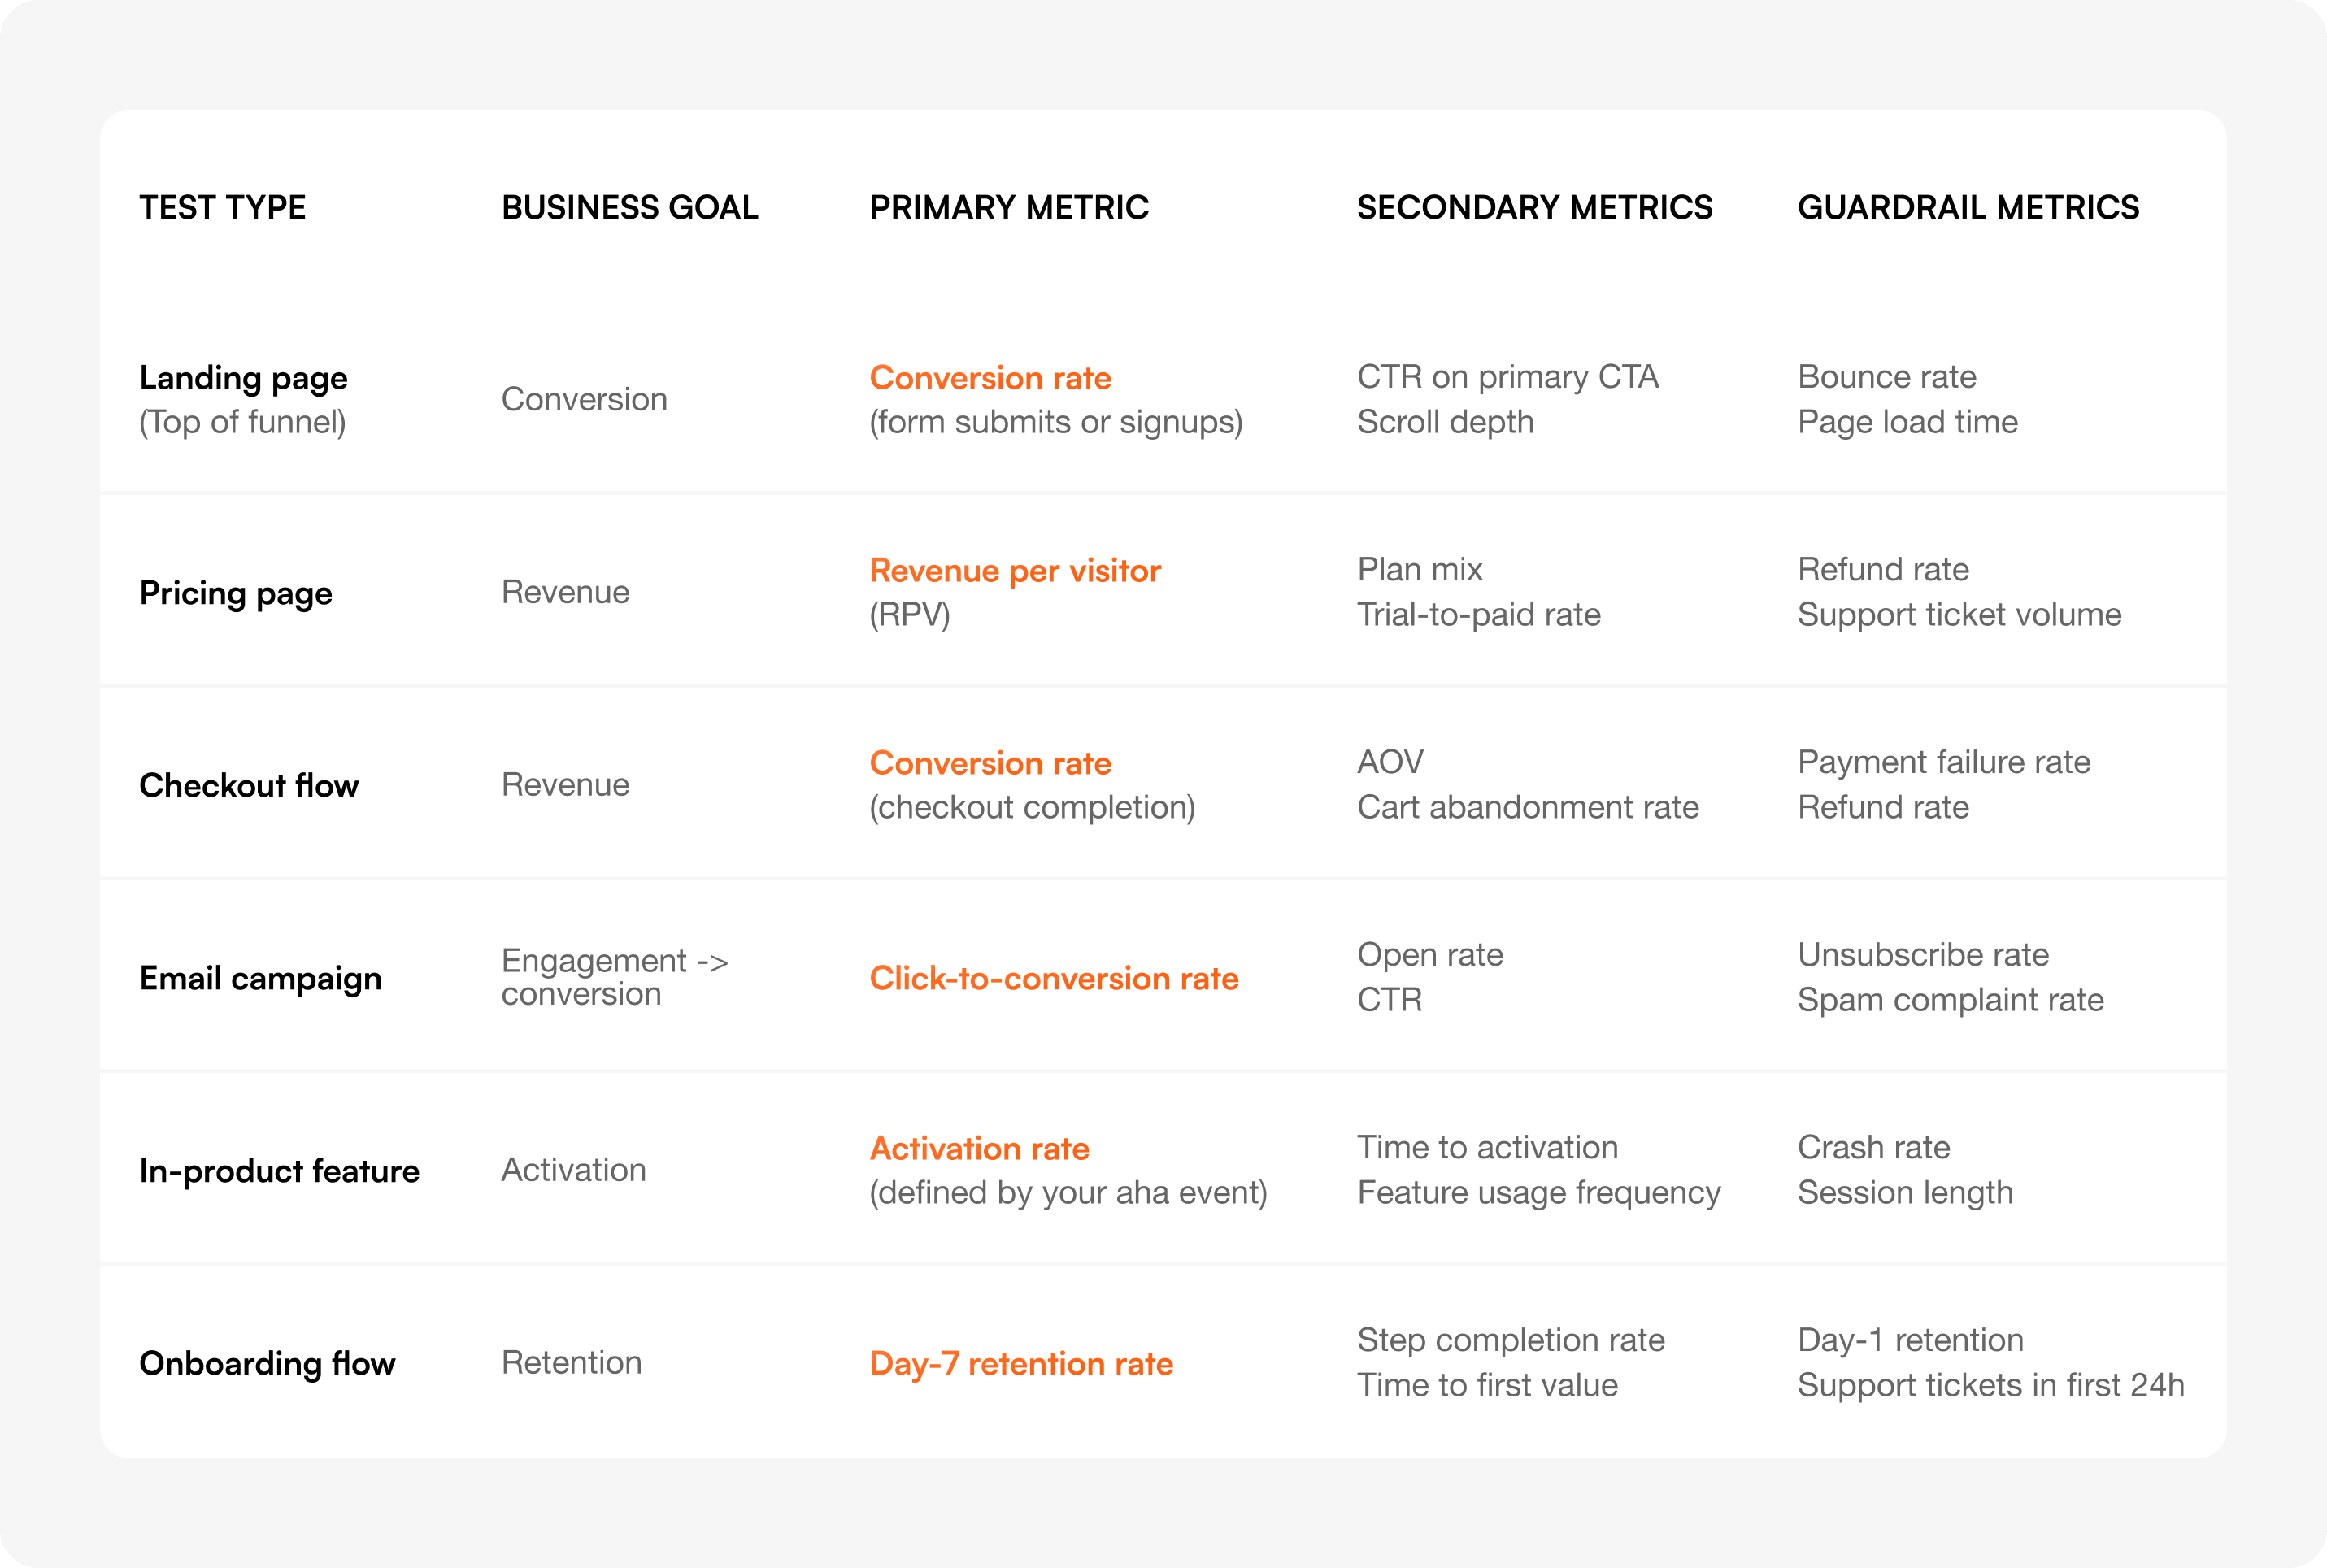
Use the matrix below to choose. Find what you're testing, find your business goal, and read across.
Save this matrix or screenshot the row that matches your next test. The rest of this guide explains each metric in detail and shows you how to set thresholds for the guardrails.
Every metric below has a definition, a formula, when to use it, when to avoid it, and a worked example. Most articles on this topic give you a list. This one tells you when each metric will mislead you.
Definition: The percentage of visitors who complete a defined goal action (signup, purchase, demo request).
Formula: Conversion rate = (Conversions ÷ Total visitors) × 100
Use when: Your test directly affects a single, well-defined action — most landing pages, signup flows, checkout pages.
Avoid when: The action you're optimizing for is far removed from revenue (e.g., "trial signups" when you actually care about paid conversions). Optimize close to revenue when you can.
Example: A landing page redesign goes from 3.2% to 4.1% conversion on demo requests across 12,000 visitors per variant. Lift: +28% relative, +0.9 percentage points absolute. Pre-set MDE was 0.5 points, so the result clears practical significance.
Definition: The percentage of users who click a specific element after seeing it.
Formula: CTR = (Clicks ÷ Impressions) × 100
Use when: Testing isolated UI elements where the click is the only meaningful action — banner copy, navigation labels, ad creative.
Avoid when: You haven't checked what happens after the click. CTR is a leading indicator, not a business outcome. A change can lift CTR and still reduce conversions if the new copy attracts the wrong audience.
Example: Changing a hero CTA from "Learn more" to "Start free trial" lifts CTR from 4.8% to 7.2%. But downstream signup rate drops because "Start free trial" pulls in higher-intent users who get filtered earlier in the funnel — net signups stay flat. Always pair CTR with the downstream metric.
Definition: The average revenue generated by each visitor, regardless of whether they purchased.
Formula: RPV = Total revenue ÷ Total visitors
Use when: Testing anything on a paid product page — pricing, plan layout, checkout copy. RPV catches both "more people buy" and "buyers spend more" in a single number.
Avoid when: Your test is on a top-of-funnel page where almost no visitor will purchase in-session. RPV with too few buyers becomes a noisy mess of zeros plus a few large numbers.
Example: A pricing page test moves the "Most popular" badge from the Pro plan to the Business plan. Conversion rate stays flat at 6.1%, but RPV jumps from $4.20 to $5.80 because more buyers pick the higher tier. RPV catches the win that conversion rate alone would miss. With Optibase, revenue per visitor is tracked automatically across multiple currencies and connected to your variant assignments — no manual instrumentation.
Definition: The average value of a single purchase or contract.
Formula: AOV = Total revenue ÷ Total orders
Use when: Testing changes that should encourage larger purchases — bundle offers, upsell prompts, free shipping thresholds, plan comparison layouts.
Avoid when: Testing top-of-funnel pages. AOV without a conversion-rate guardrail is dangerous: you can lift AOV by alienating low-value buyers and still hurt total revenue.
Example: Adding a "Free shipping over $50" banner lifts AOV from $42 to $58 — but conversion rate drops 11%. Total revenue per visitor falls. AOV won, the business lost. Always pair AOV with conversion rate or RPV.
Definition: The percentage of sessions where the user viewed only one page and triggered no other interaction.
Formula: Bounce rate = (Single-page sessions ÷ Total sessions) × 100
Use when: Investigating why a page underperforms, paired with heatmaps and session recordings. Bounce rate is a diagnostic signal.
Avoid when: Using it as your primary metric. It's the most overrated number in this list. A high bounce rate on a one-page checkout is fine. A low bounce rate on a confusing pricing page is a sign of frustrated scrolling, not engagement.
Example: A blog post has a 78% bounce rate. That's not a problem — the content is self-contained and ranks for a long-tail query. People read, get the answer, leave. Don't optimize for engagement when the user's job is done. Pair bounce rate with heatmaps and session recordings to understand whether bounces are happy or frustrated.
Definition: Average time a user spends on a page before navigating away or going idle.
Formula: Time on page = Total time across sessions ÷ Total sessions
Use when: Testing content depth, video engagement, or scannable vs. detailed layouts.
Avoid when: Treating "longer = better" as a rule. On a pricing page, longer time can mean confusion. On a tutorial page, shorter time can mean the user found the answer quickly. Context matters.
Example: A new pricing layout reduces average time on page from 1:47 to 1:12. That's a win — users found their plan faster — confirmed by a 9% lift in trial signups.
Definition: How far down the page users scroll, typically measured in percentages (25%, 50%, 75%, 100%).
Formula: Scroll depth = (Furthest pixel scrolled ÷ Total page height) × 100
Use when: Testing long pages where information hierarchy matters — landing pages, articles, product pages with detailed feature sections.
Avoid when: Testing short pages. If the page fits in a viewport, scroll depth tells you nothing.
Example: A landing page redesign moves social proof from below the fold to above it. 50% scroll depth drops from 64% to 41%, but conversion rate climbs 14%. Users now have what they need before they need to scroll.
Definition: The average number of unique pages a user views in a single session.
Formula: Pages per session = Total page views ÷ Total sessions
Use when: Testing navigation, internal linking, or content discovery on content-driven sites.
Avoid when: On task-driven products. A user who completes their task in one page is a success, not a failure. More pages can mean more friction.
Example: Adding related posts to the bottom of articles increases pages per session from 1.4 to 2.1 and time on site by 47%. Good for ad-supported content sites, neutral or negative for SaaS where you want users to convert and leave.
Definition: The total cost to acquire a paying customer, including ads, sales, content, and tools.
Formula: CAC = Total acquisition spend ÷ Number of new customers
Use when: Comparing channels, validating paid campaigns, or evaluating whether a new pricing test is sustainable. Always compare CAC to LTV.
Avoid when: As a per-test metric. CAC stabilizes over months, not weeks. Use it to evaluate the outcome of a series of tests, not a single experiment.
Example: Three months of pricing and onboarding tests reduce CAC from $340 to $260 by lifting trial-to-paid conversion. The individual tests measured conversion rate; the cumulative impact showed up in CAC.
Definition: The total revenue you expect from a single customer across their entire relationship with you.
Formula: LTV = ARPU × Average customer lifespan (For subscription products: LTV = ARPU ÷ Monthly churn rate)
Use when: Evaluating whether a conversion lift is sustainable. A test that doubles signups but pulls in customers who churn in 60 days isn't a win.
Avoid when: Trying to read LTV inside a single test window. LTV is a strategic metric, not an experiment metric. Use it as a guardrail check 30–90 days after a winning test ships.
Example: A test that simplified pricing increased trial signups 22%. Three months later, paid retention on that cohort matched the control — LTV held. The test gets confirmed as a true win.
Definition: The percentage of new users who reach a defined "aha moment" — the action that predicts long-term retention.
Formula: Activation rate = (Users who hit activation event ÷ Total new users) × 100
Use when: Testing onboarding flows, empty states, first-run experiences, or any in-product change for new users.
Avoid when: You haven't defined the aha moment. Activation without a clear definition becomes "people who clicked something" — meaningless.
Example: For a project management tool, "created a project and invited a teammate within 7 days" is the activation event. An onboarding redesign lifts activation from 34% to 41%. Day-30 retention improves correspondingly.
Definition: The percentage of customers who continue using or paying for the product over a given period (or who stop, for churn).
Formula: Retention rate = (Customers at end of period ÷ Customers at start of period) × 100 and Churn rate = 100 − Retention rate
Use when: Evaluating long-term health, not single tests. Use as a guardrail for acquisition and onboarding tests — if retention drops, your acquisition "win" was actually a leak.
Avoid when: Trying to measure retention inside a 14-day test window. You can't.
Example: A signup flow test lifts new signups by 31%. Day-30 retention drops from 58% to 49%. Net active users at Day 30 actually increase — the test wins on volume — but the retention drop is a flag to investigate why.
Most teams pick a primary metric, watch it move, and ship. They don't notice the unintended damage until support tickets spike or revenue slips a quarter later.
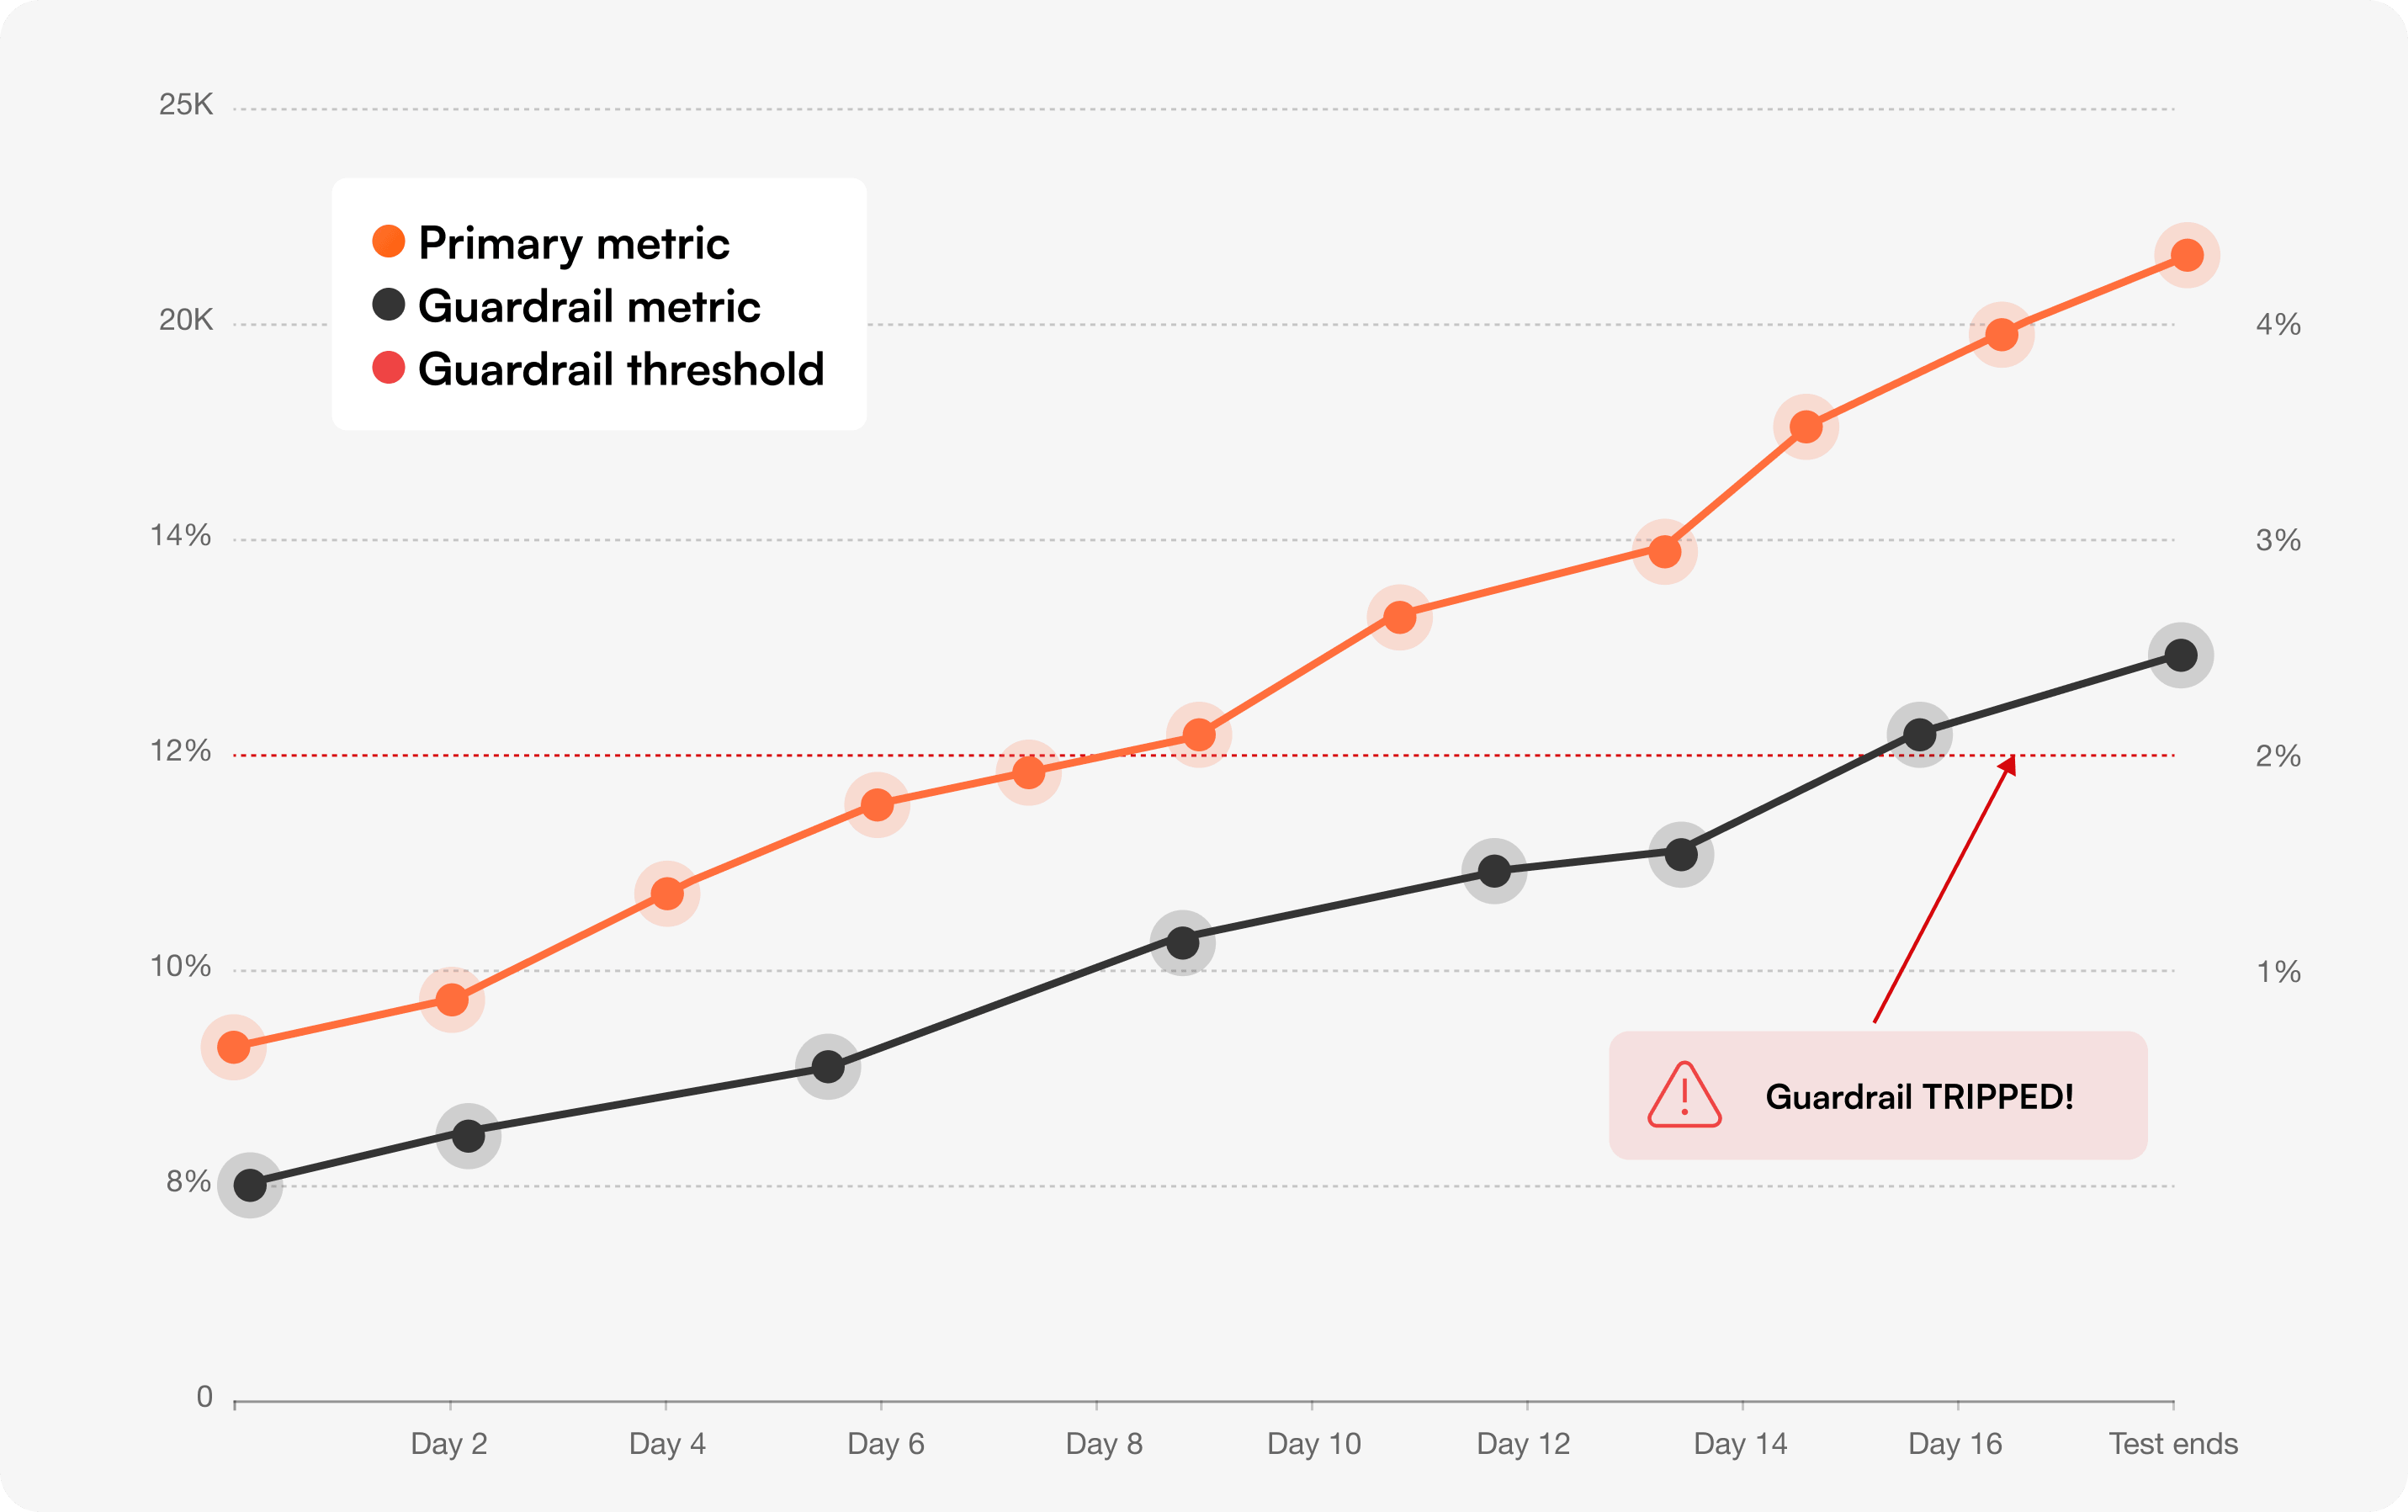
Guardrail metrics catch that damage during the test, not after. They're the metrics you don't want to improve — you want to make sure the test didn't hurt them.
A guardrail metric should be:
The simplest rule: a guardrail trips if it gets statistically worse, even if the primary metric is winning.
A more nuanced approach is to set a practical threshold based on business cost. If a 5% increase in refund rate would cost more than the conversion lift is worth, that's your line. Crossing it stops the test even if the primary metric still wins.
For Bayesian readers: monitor the probability that the guardrail metric is worse than control. If P(guardrail worse) > 90%, treat it as tripped.
Manual guardrail checks fail because they require remembering to check. Automate them.
In Optibase, every test can be configured with guardrail metrics that auto-stop the experiment if the threshold is crossed. The Bayesian engine (Probability to Be Best) evaluates both the primary and the guardrail continuously — winners get shipped, guardrail breaches get flagged before they ship.
1. The checkout speed test that broke refunds. A SaaS company removed the order-summary review step in checkout. Conversion lifted 8%. Refund rate jumped from 2.1% to 3.4% — buyers were completing purchases they didn't fully understand. Net revenue dropped. The review step went back.
2. The pricing page with a phantom win. An ecommerce brand A/B tested removing the price comparison table. RPV climbed 6%. But support ticket volume on "what's included in plan X" doubled in the next 14 days. The guardrail caught a hidden cost the primary metric never saw.
3. The onboarding "lift" that killed retention. A B2B tool simplified onboarding to a single screen. Activation climbed from 28% to 39%. Day-7 retention dropped from 61% to 48% — users activated faster but didn't understand the product deeply enough to come back. The "winning" variant got rolled back at the 14-day guardrail check.
In all three cases, the team would have shipped the change without guardrails. Guardrails turn "the test won" into "the test is safe to ship."
You can run a test, see a 12% lift, and still be looking at random noise. Statistics is what tells you whether to trust the result.
Statistical significance means the result is unlikely to have happened by chance. The standard threshold is 95% confidence — meaning there's only a 5% probability the lift you're seeing is a fluke.
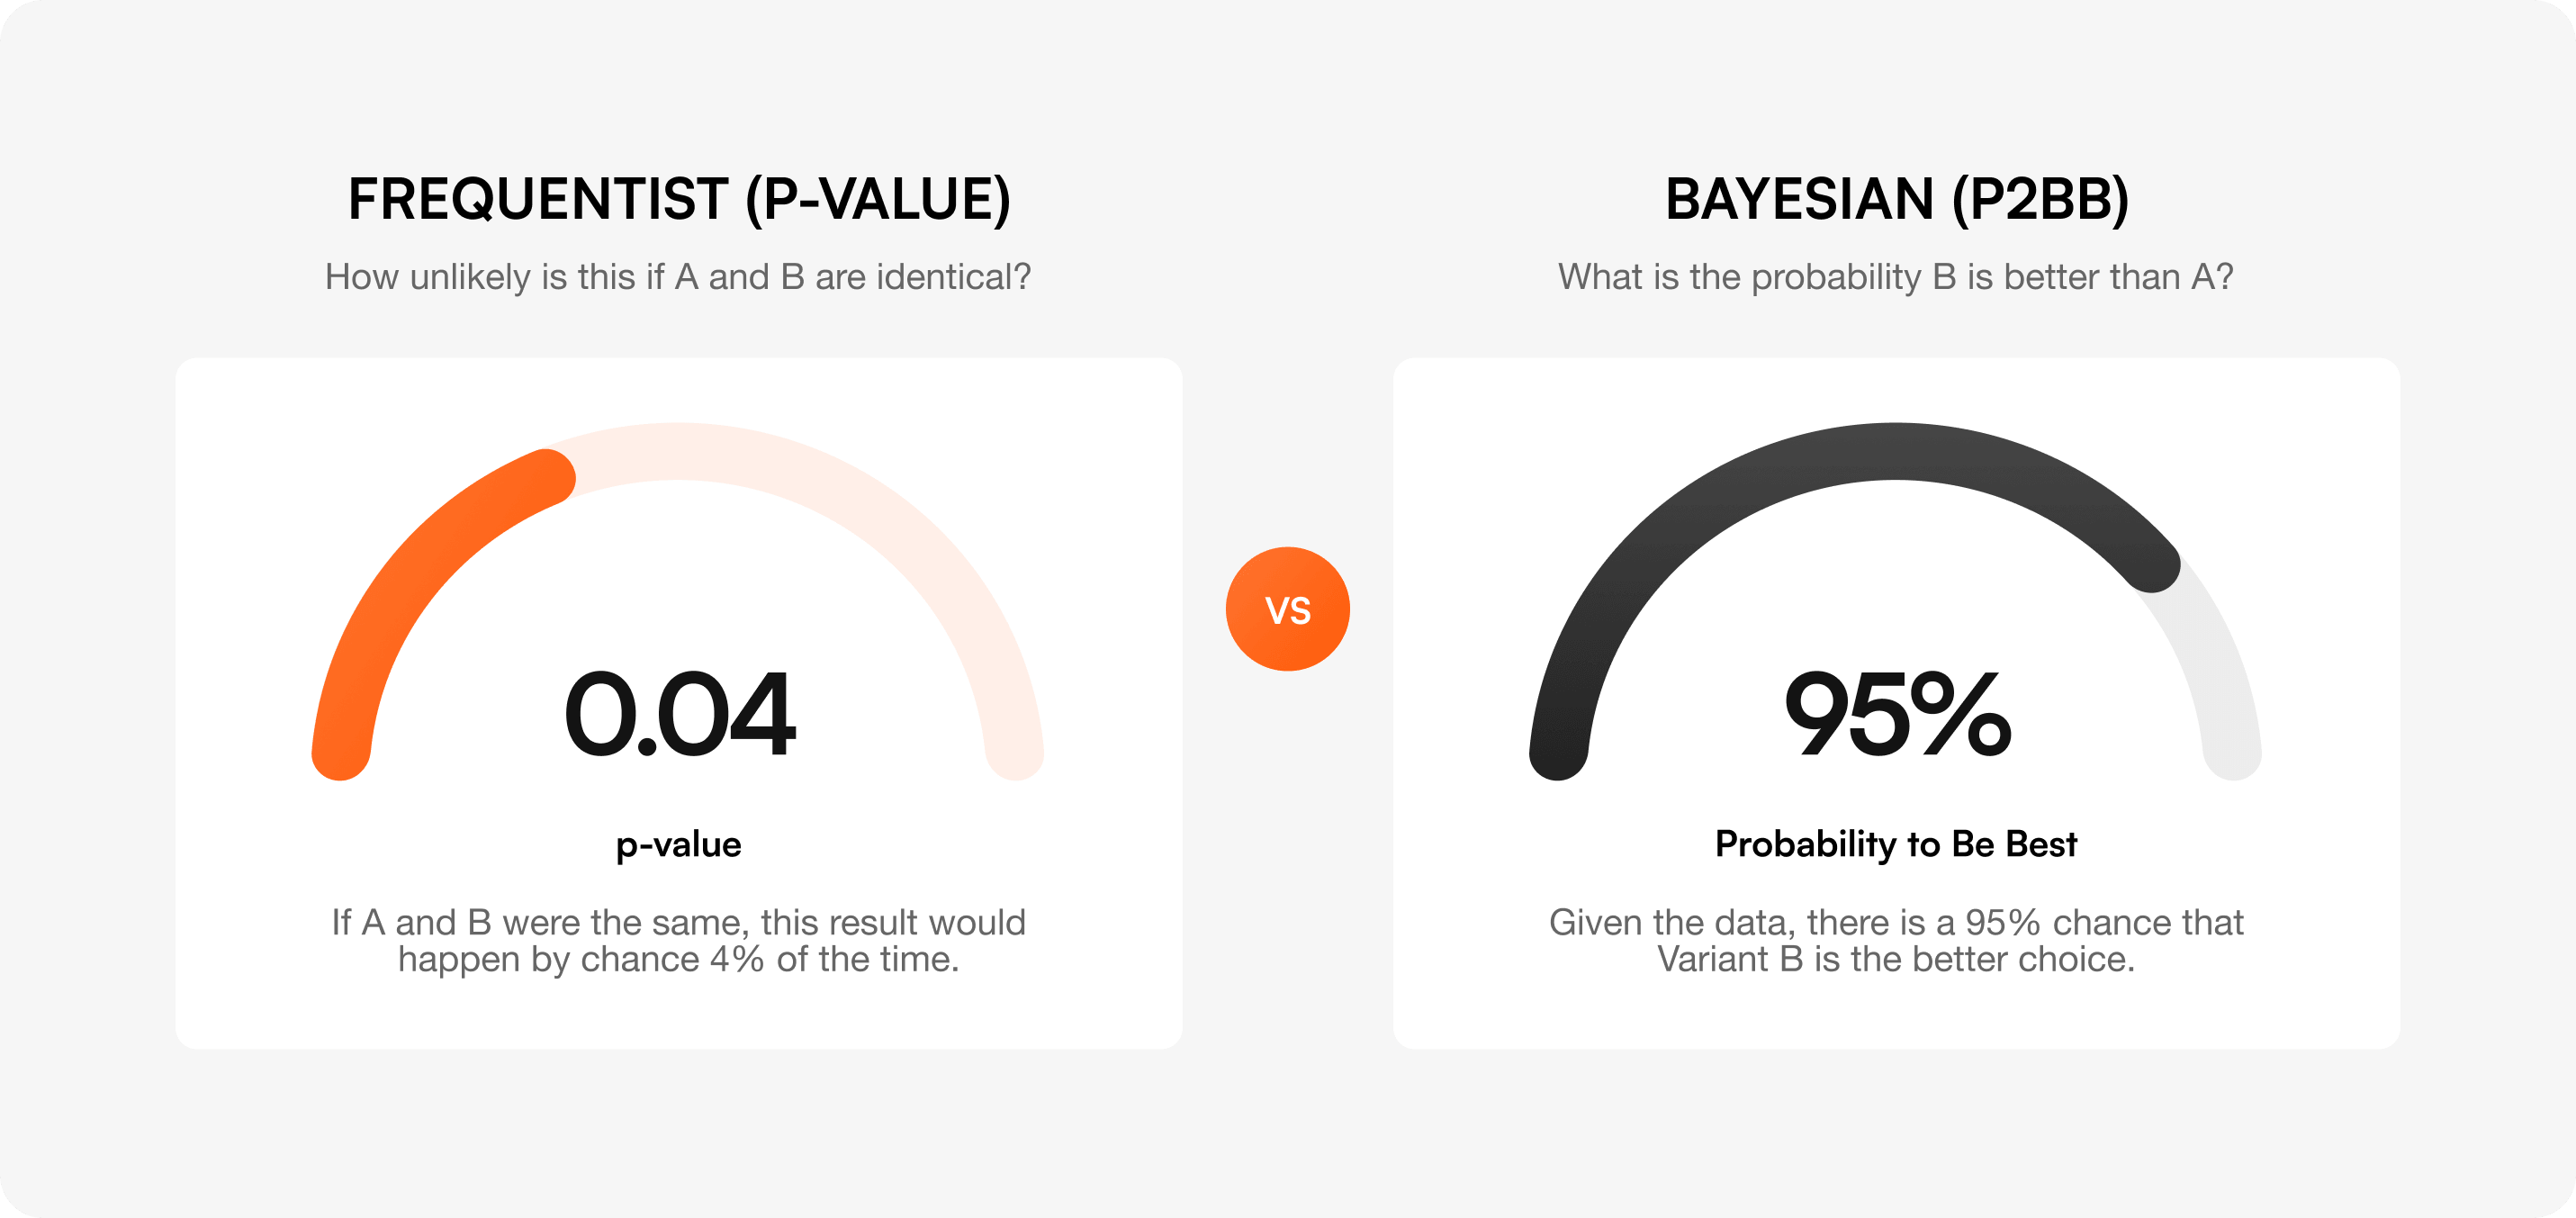
The p-value is the probability that you'd see a result at least this large if the variants were actually identical. A p-value of 0.04 means: "If A and B were the same, this result would happen by chance 4% of the time." A p-value below 0.05 typically clears the 95% confidence bar.
Confidence intervals tell you the range your true lift likely falls in. A reported lift of "+8% (95% CI: +2% to +14%)" means the true effect is most likely between +2% and +14%. Watch the lower bound — if it crosses zero, the test isn't conclusive.
Frequentist statistics asks: "How unlikely is this if A and B are identical?" Bayesian statistics asks the more useful question: "What's the probability that B is actually better than A?"
That probability is called Probability to Be Best (P2BB). A P2BB of 95% means: given the data, there's a 95% chance the variant is the better choice. Unlike p-values, you can read P2BB at any point during the test without inflating false positives — it doesn't suffer from the "peeking" problem.
This is the engine Optibase uses by default. It's faster to a decision, easier to interpret, and naturally extends to multiple guardrails.
Sample size depends on four inputs:
The table below shows the sample size you need per variant for common combinations of baseline rate and MDE (assuming 80% power, 95% significance, two-tailed test).
For a deeper calculation, use our sample size calculator or the duration calculator to estimate how long the test will take given your traffic.
Even if you hit your sample size in 3 days, run the test for at least one full week. User behavior on Tuesday isn't the same as on Saturday. For B2B, run two full business weeks.
For high-traffic ecommerce, also account for monthly cycles (paydays, end-of-month). A test run only in the last week of the month will misrepresent buyer behavior in the first three weeks.
Most teams obsess over Type I and ignore Type II. Both cost real money.
These show up in almost every program that's been running A/B tests for less than two years. Most show up in programs that have been running them for longer, too.
1. Peeking at results before reaching significance
Checking your test daily and stopping the moment p < 0.05 inflates your false positive rate from 5% to 20%+ depending on how often you peek. Either pre-commit to a sample size and don't look, or use Bayesian P2BB which is robust to peeking.
Lifting CTR on a button doesn't mean anything if downstream conversion stays flat. Always optimize as close to revenue (or your true business outcome) as you can credibly measure.
Refund rates, support tickets, page speed, and retention all degrade quietly. By the time someone notices, you've shipped 20 changes and don't know which one caused it. Pre-register guardrails for every test.
Setting your MDE at 1% means you'll need hundreds of thousands of users per variant. The test will run for months, conditions will change, and the result will be unreliable anyway. Pick the smallest lift that's worth shipping for, not the smallest lift you can detect.
Testing 10 secondary metrics and finding one with p < 0.05 doesn't mean you found a real effect. With 10 metrics, you'd expect one false positive by chance alone. Apply a correction (Bonferroni, Holm) or limit yourself to one primary metric and use the rest as directional context only.
A test can show a "statistically significant" 0.3% lift across 2 million users. Statistically real, practically meaningless. Set a minimum business-impact threshold before the test starts. If the lift doesn't clear it, don't ship — no matter how clean the p-value.
"We optimized for CTR but actually time-on-page improved more, so we're calling that the win." This is p-hacking. Pre-register the primary metric before the test starts. Write it down. If you change it mid-test, you've stopped running an experiment and started running a story.
For a fuller breakdown of how to avoid these in practice, see our guide to the most common A/B testing mistakes.
Before launching any A/B test, work through this list:
Optibase is built for teams that want to run rigorous A/B tests without buying enterprise software. The platform tracks every metric on this page automatically and applies the statistical methods we just walked through.
For the broader landscape of testing tools and how Optibase compares, see our best A/B testing platforms breakdown.
The 7 anti-patterns — peeking, vanity metrics, ignored guardrails, tiny MDEs, multiple comparisons, statistical-vs-practical confusion, and changing the primary metric — derail most programs. Pre-launch checklists prevent almost all of them.
Track one primary metric that defines the win, two or three secondary metrics that add context, and at least two guardrail metrics that catch unintended damage. The primary should be tied to revenue or a clear business outcome — not a vanity metric like CTR. Use the decision matrix above to pick the right combination for your test type.
Pick the metric closest to revenue or your true business outcome that you can measure inside the test window. For a checkout test, that's checkout conversion rate. For a pricing test, that's revenue per visitor. For an onboarding test, that's activation rate. If you can't decide between two metrics, you haven't defined the goal of the test yet — go back and clarify.
Statistical significance means the result you're seeing is unlikely to be random noise. The standard threshold is 95% confidence (p < 0.05) — there's only a 5% chance the lift you observed would happen if the variants were actually identical. Bayesian alternatives like Probability to Be Best (P2BB) measure the same idea but in more interpretable form: "there's a 95% chance B is better than A."
Long enough to reach your pre-calculated sample size and cover at least one full business cycle — typically a week, often two. User behavior varies by day of week, payday, and month-end. Stopping the moment you hit significance is "peeking" and inflates false positives. If you're using Bayesian methods like P2BB, you can stop earlier without that penalty, but still cover a full business cycle.
Guardrail metrics are the metrics you don't want to improve — you want to make sure your test didn't break them. A pricing test might have refund rate as a guardrail. An onboarding test might have day-7 retention. They catch tests that win on the primary metric but cause downstream damage you'd otherwise discover months later.
No. Bounce rate is too dependent on context to be a reliable primary metric. A high bounce on a one-page checkout is fine. A low bounce on a confusing pricing page is bad. Use bounce rate as a diagnostic signal alongside heatmaps and session recordings, not as the metric that defines your win.
The primary metric defines whether the test won — pick exactly one and pre-register it. Secondary metrics add context (was the lift driven by more buyers or larger orders?) but don't determine the outcome. Guardrail metrics are the things that mustn't get worse — they catch unintended damage. Every test should have one primary, two or three secondary, and at least two guardrails.
Leading metrics move quickly and predict future outcomes — CTR, scroll depth, activation rate. Lagging metrics move slowly and confirm what already happened — LTV, retention, CAC. Use leading metrics as the primary metric for fast tests and lagging metrics as the guardrails or post-launch confirmation that a winning test actually held up.
One primary, two or three secondary, and two or more guardrails. That's it. Tracking 10+ metrics introduces the multiple comparison problem (mistake #5) and tempts you into post-hoc metric changes (mistake #7). If you find yourself wanting to track more, ask whether you're really running one experiment or several.
Picking the right metrics isn't the glamorous part of A/B testing, but it's the part that determines whether your program ships changes that move the business — or just changes that move a number.
If you've been running tests and aren't sure which numbers actually matter, this is your sign to fix that. Use the decision matrix at the top of this guide every time you launch a test. Pre-register your primary metric. Set guardrails with real thresholds. Calculate sample size before, not after. Stop when you reach significance and not a day later. And run the pre-test checklist as a 60-second sanity check before every experiment.
If you want a CRO platform that tracks all 12 metrics automatically, runs Bayesian P2BB by default, and auto-stops on guardrail breaches, Optibase is built for Webflow and WordPress sites that want serious experimentation without enterprise pricing. You can start free (no credit card required) or book a demo if you want a walk-through with our team.
The best A/B testing programs aren't the ones that run the most tests. They're the ones that pick the right metric every time.